Author Archives: Vikas

Food for thought: Food as medicine

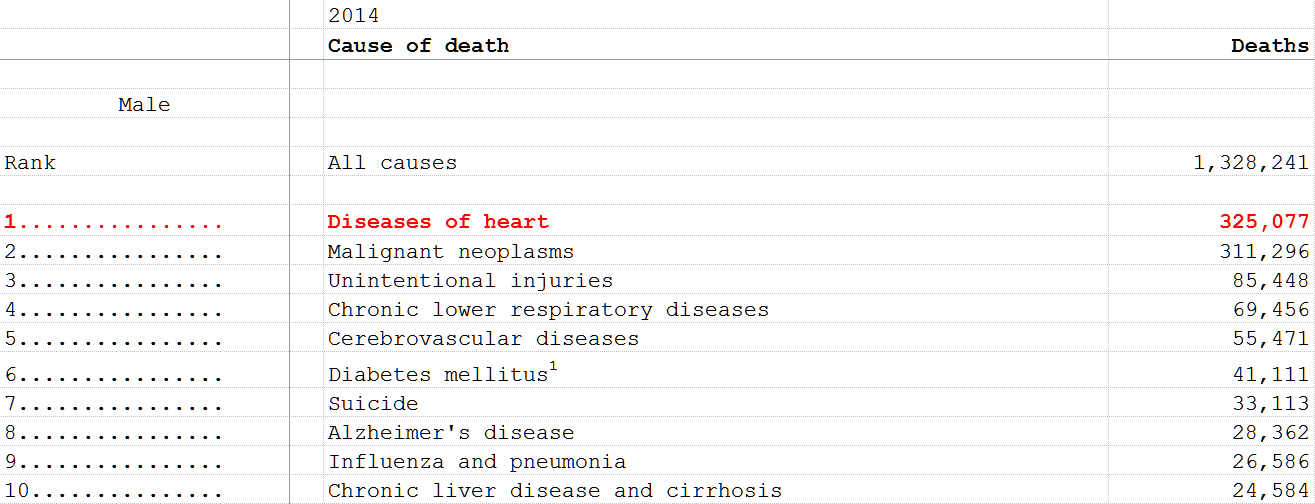
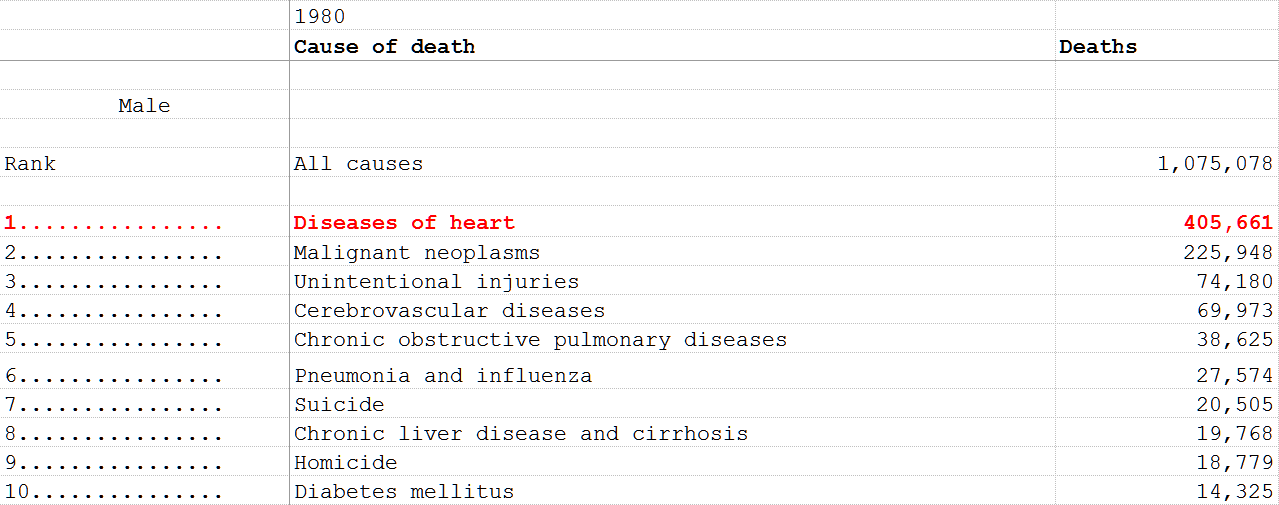
This is men’s health week (June 12th – June 16th) and indeed this month is men’s health month. Over the last 35+ years, even though the rates and absolute numbers have reduced somewhat, heart disease has remained the leading cause of death for men.

Kim Williams, Cardiologist at Rush University Medical Center in Chicago and President of the American College of Cardiologists in 2015 talks about the role that a plant based diet can play in reducing cardiovascular risk. Note that he doesn’t insist that you completely stop eating red meat (although that’s something that he himself has done) but that you adopt a more judicious and thoughtful approach to it. Read his full interview with The University of Chicago magazine here. Do yourself and your loved ones a favor this June – take a look at your diet, exercise, alcohol and other lifestyle choices and think about how it might impact your goals.


Do Certain Minority Ethnic Groups Receive Poorer Care?

According to research, in the US and UK, certain minority ethnic groups report lower patient experience scores compared to the majority population. For example, analysis of the English General Practice Patient Survey found that South Asian groups report particularly low scores compared to the White British majority.

Fig 1.
Fig 2: Age and gender-specific differences, with 95% confidence intervals, in reported GP–patient communication scores (0–100 scale) between white British patients and responders in Asian and white ethnic groups.

Even though half of the difference in these scores is explained by the concentration of South Asian patients in low-scoring primary care practices, the remaining half has been unexplained. Of course, the open question has been whether South Asian patients receive lower quality care, or whether they receive similar care, but rate this more negatively. Now, a study attempts to understand this disparity and underlying causes and their work shows that the lower scores by minority ethnic groups, at least in the context of GP surveys in England reflects worse experiences of communication compared to the White British majority.


Sources:

Fig 1: Understanding why some ethnic minority patients evaluate medical care more negatively than white patients: a cross sectional analysis of a routine patient survey in English general practices. http://www.bmj.com/content/339/bmj.b3450

Fig 2: Variations in GP–patient communication by ethnicity, age, and gender: evidence from a national primary care patient survey. http://bjgp.org/content/66/642/e47

PARR-30: An Example of A Transparent and Open Published Research

In my other post earlier today, I made a plea for researchers to include model details for research done on retrospective data. I thought it will be a good idea to include an example of what it might look like and how it is helpful.

A good example is the research done in England and published on BMJ Open in 2012 that led to development of a predictive model to identify inpatients at risk of re-admission within 30 days of discharge (PARR-30).

The paper lists the coefficients of their logistic regression model

PARR-30_Coeff


It has a worked example of how a risk score can be calculated

PARR-30_ScoreCalc


The supplemental website has lots of information to help you implement or validate this model for your own population

PARR-30_Website

Data driven healthcare studies should include model details

The quality and quantity of healthcare data is on an upward trajectory as EMRs become more ubiquitous. One of the many benefits of this data has accrued to researchers who are increasingly using retrospective analysis to publish meaningful research. This is good news because as noted recently by Jeffrey Drazen, MD, Editor-in-Chief of the NEJM

the number of evidence-based recommendations built on randomized controlled trials (RCTs), the current gold standard for data quality, is insufficient to address the majority of clinical decisions.

However, one disappointment that I have encountered fairly consistently with these research studies is that they very rarely, if at all, include details regarding the model.  The most information that they may have regarding the modeling exercise will be the types of models that were considered (for example, logistic regression, naive Bayes, SVM etc.) and measures of their statistical performance. Very rarely will they contain details for those models such as the coefficients, conditional probabilities etc. The exceptions that I have seen are papers published outside of the US, most often from NHS or from Canada. For example, in this post, I discuss a study from NHS that develops a 30-day readmission risk model. The information available in this paper should be par for the course for all such publicly funded research.

Now, I understand that algorithms and models can be a competitive advantage and why someone may opt to not make their secret sauce public. But for research studies that are funded through public grants such as those from NHS, it should be required that not only the model details be made available but the underlying data set (if it can be satisfactorily de-identified) should be publicly shared as well. The idea behind publicly supported research is to advance the knowledge base in a given field and the best way to do so is to share as much as possible regarding the research so that other individuals and organizations can learn from it and carry the field forward.
 

Compare Hospitals In Your Area With These Convenient Online Tools

Nowadays, before you head to a restaurant for an evening of gorging, you are likely to check out ratings of the place using an online tool such as Yelp! Yet, are you able to look up ratings of a hospital before heading there to receive care?

Admittedly (no pun intended), evaluating hospitals is nowhere near as straightforward as evaluating restaurants and the downside of erroneous evaluations is much lower when looking at restaurants. Still, you can use the following two sites to get some sense of how hospitals in your area are performing on some of the more widely accepted metrics. The metrics used by these sites are a good mix of process and outcomes. Check them out!


Screen Shot 2013-05-11 at 12.32.12 AM Screen Shot 2013-05-11 at 12.32.27 AM